REal estate market facts -
Australian Capital Territory Sales
Welcome
Welcome to Agent Team's Real Estate Market Facts! In this first series, we're diving into the latest data on house sales, median sales prices, and residential yields in the ACT. Whether you're buying, selling, or investing, staying informed on the local real estate market can help you make the best decisions. Let's explore the key trends shaping the ACT property landscape today.
Australian capital territory sales
house sales
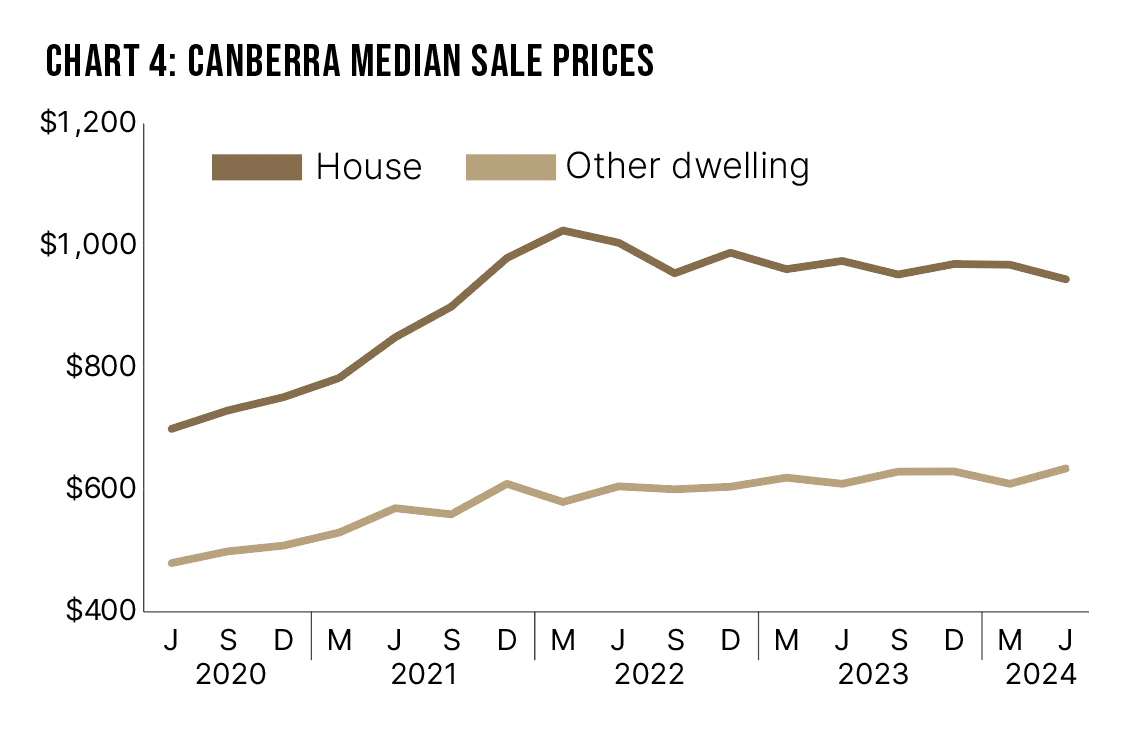
The median price for houses in Canberra decreased to $945,000 over the June quarter, a decrease of 2.5% over the quarter and 3.1% over the year. Over the quarter, the median price for houses increased in West and North (0.6%) and Outer South (1.0%), but decreased in Inner Central (-5.6%) and Inner South (-2.8%) Over the past year, the median price for houses increased in Outer South (2.0%), but decreased in Inner Central (-2.9%), Inner South (-2.6%) and West and North (-0.5%).
Other dwelling sales
The median price for other dwellings in Canberra increased to $635,000 over the quarter, an increase of 4.1% both over the quarter, and over the year. Over the quarter, the median price for other dwellings increased in all Canberra areas: Inner Central (3.2%), Inner South (5.2%), West and North (4.3%) and Outer South (6.4%). Over the past year, the median price for other dwellings increased in all Canberra areas: Inner Central (3.2%), Inner South (5.6%), West and North (3.4%) and Outer South (4.7%).
Table 7: Australian Capital Territory house sales
Number of sales | Median price ($’000) | Quarter % change | Annual % change | Lower quartile ($’000) | Upper quartile ($’000) | |
Canberra | 838 | 945.0 | -2.5% | -3.1% | 810.0 | 1,175.0 |
Inner Central | 98 | 1,456.0 | -5.6% | -2.9% | 1,200.0 | 1,800.0 |
Inner South | 106 | 1,069.0 | -2.8% | -2.6% | 905.0 | 1,415.0 |
West & North | 418 | 915.0 | 0.6% | -0.5% | 787.0 | 1,050.0 |
Outer South | 216 | 869.0 | 1.0% | 2.0% | 777.5 | 1,006.0 |
Table 8: Australian Capital Territory other dwelling sales
Number of sales | Median price ($’000) | Quarter % change | Annual % change | Lower quartile ($’000) | Upper quartile ($’000) | |
Canberra | 1,065 | 635.0 | 4.1% | 4.1% | 488.0 | 755.0 |
Inner Central | 411 | 650.0 | 3.2% | 3.2% | 495.0 | 809.9 |
Inner South | 101 | 652.5 | 5.2% | 5.6% | 475.0 | 855.0 |
West & North | 383 | 600.0 | 4.3% | 3.4% | 440.0 | 720.0 |
Outer South | 170 | 659.5 | 6.4% | 4.7% | 530.0 | 730.0 |
Your Agent
Victoria McLaughlin
With over a decade of experience in property management and deep knowledge of the Canberra market, Victoria is a dedicated professional who invests significant time and energy into her clients.
She excels at maximising landlords’ returns and helping tenants find their perfect homes. Known for her exemplary service and market insight, Victoria delivers the best outcomes for investors. Her expertise, charisma, and passion for genuine human connections enable her to understand client needs and create tailored solutions that exceed expectations.
Inspired by Agent Team's progressive approach and strong support network, her friendliness, reliability, and dedication contribute to the growth of the Agent Team portfolio
Let's turn your real estate dreams into reality together.
P 0456821439
Testimonials
"I had an incredible experience with Victoria who went above and beyond to find the perfect tenant in a challenging market.
In the past, I opted for cheaper property managers, but this time I chose a premium agent, and it was worth every penny. The dedication, professionalism, and attention to detail were outstanding. Victoria conducted thorough screenings, communicated effectively, and ensured the entire process was seamless.
Her expertise truly shone through, and I couldn't be happier with the results. I highly recommend her top-notch service for anyone seeking exceptional property management services."
"We recently had the pleasure of working with Victoria and her team to rent out our property, and the experience exceeded all expectations. From the outset, Victoria demonstrated an impressive ability to tailor her strategy to our specific needs, rather than employing a generic, one-size-fits-all approach.
Her dedication to personalised service ensured that every aspect of the process was meticulously managed. Victoria's knowledge of the area, professionalism and expertise were evident at every step, making us feel confident and secure. Even if the management fee were double, we would still entrust Victoria and her team with our property.
She is worth every cent!"